What One Ounce of Silver Can Buy: A Commodity Price Comparison
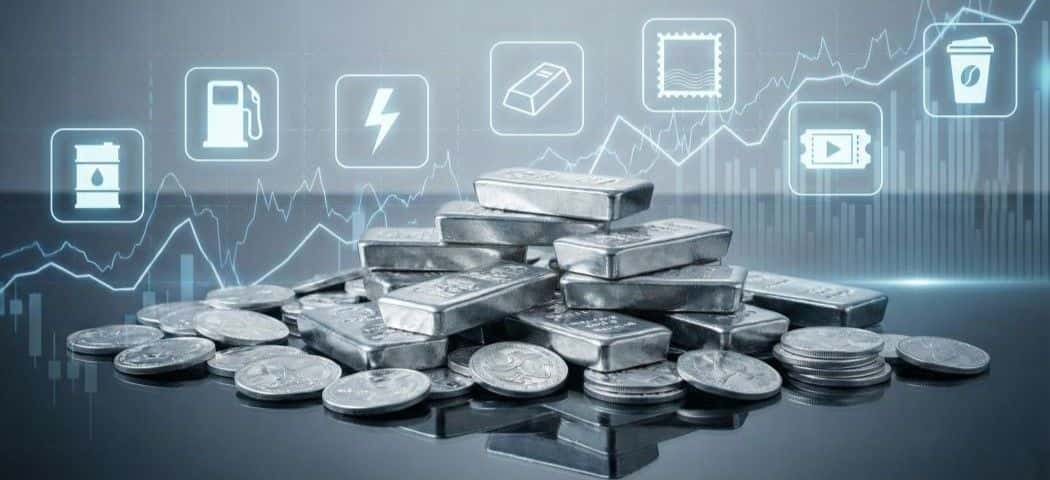
Silver’s Remarkable Rise Reshapes Investor Perspectives
As the spot price of silver surges toward $64 per ounce, the metal is entering one of its strongest periods in decades. This breakout has not only captured the attention of precious metals investors — it has also created striking price relationships across global markets. For the first time in years, a single ounce of silver now buys far more in real-world goods and commodities, revealing just how dramatically global electrification and tightening supply have shifted silver’s value.
Below, Bullion Exchanges explores some of the most compelling comparisons, showing what $64 silver represents in today’s economic landscape — and what these ratios say about the future of precious metals investing.
What Silver Can Buy: A Real-World Price Comparison Guide
1. Silver vs. Crude Oil (per barrel)
Oil ~ $60 per barrel
-
1 oz of silver = 1.06 barrels of oil
This comparison is one of the clearest signs of silver’s rising power in the commodity world. Historically, oil has been significantly more expensive on a per-unit basis, but today silver actually exceeds the value of a barrel (42 U.S. gallons). This inversion reflects silver’s tightening supply dynamics and rising relevance in high-tech industries.
2. Silver vs. Gasoline (per gallon)
Gasoline ~ $3.75 per gallon
-
1 oz of silver = 17 gallons of gasoline
Silver’s ability to purchase nearly 17 gallons of fuel shows how strongly it has held purchasing power during inflationary conditions. While gas prices fluctuate with geopolitical and seasonal trends, silver’s appreciation has outpaced these rises. This makes silver a compelling hedge against consumer energy costs.
3. Silver vs. Minimum Wage (per hour)
U.S. minimum wage benchmark ~ $15/hr
-
1 oz of silver = 4.26 hours of labor
One ounce of silver now represents more than half a traditional workday. This comparison underscores silver’s ability to preserve value even as labor markets face wage stagnation. For many investors, silver’s relationship to hourly earnings offers a relatable benchmark for long-term purchasing power.
4. Silver vs. Copper (per pound)
Copper ~ $5.50/lb
-
1 oz of silver = 11.6 pounds of copper
This ratio highlights the vast difference between industrial metals under the electrification boom. Copper demand is rising, but silver’s price is rising even faster due to supply deficits and its irreplaceable technological applications. The widening spread emphasizes how undervalued silver remains in relation to increasing global demand.
5. Silver vs. Eggs (per dozen)
Eggs ~ $3.25/dozen
-
1 oz of silver = 19 dozen eggs
Food inflation has impacted households nationwide, yet silver has surged far beyond the pace of grocery price increases. The ability of one ounce of silver to buy nearly twenty dozen eggs shows just how strongly the metal has outperformed consumer staples. This also demonstrates silver’s resilience during periods of elevated inflation.
6. Silver vs. Coffee Drinks (latte)
Latte ~ $6.50 each
-
1 oz of silver = 9–10 lattes
Coffeehouse prices have risen consistently over the last decade, yet silver has risen faster. This makes the latte comparison a clear illustration of silver’s real-world purchasing power. It also provides an everyday benchmark for consumers who want to visualize value outside of financial markets.
7. Silver vs. Movie Tickets
Movie ticket ~ $13
-
1 oz of silver = 4–5 movie tickets
Entertainment costs continue to climb, but silver’s valuation has significantly outpaced these increases. This comparison shows that silver remains an effective store of value even against steady inflation in leisure and service pricing. It also highlights silver’s resilience as disposable-income pricing shifts.
8. Silver vs. Mobile Phone Plans (monthly)
Unlimited mobile plan ~ $60
-
1 oz of silver = 1 month of phone service
A modern phone plan is now roughly equivalent to one ounce of silver, demonstrating silver’s alignment with essential monthly expenses. As telecom costs trend upward, silver’s ability to hold value becomes even more apparent. This comparison shows why many investors treat silver as both a hedge and a spending-power stabilizer.
9. Silver vs. Electricity (kWh)
Electricity ~ $0.17/kWh
-
1 oz of silver = 376 kWh
This amount of electricity could power a typical home for several days, depending on usage. The comparison is especially symbolic because silver is a critical metal in solar energy and electrification technologies. This highlights silver’s unique role in both energy production and purchasing power preservation.
10. Silver vs. Streaming Subscriptions
Netflix ~ $16/month
-
1 oz of silver = 4 months of streaming
Subscription services steadily increase pricing, yet silver has managed to outperform these inflationary adjustments. One ounce now buys four months of entertainment, showing how well the metal tracks against digital-age consumption. This serves as a modern benchmark for evaluating real value retention.
11. Silver vs. Natural Gas Heating (per therm)
Natural gas ~ $1.10/therm
-
1 oz of silver = 58 therms
This comparison is particularly useful during winter seasons when heating bills rise. Silver’s ability to purchase a substantial quantity of heating energy demonstrates its role as a defense against rising utility prices. It reinforces why many investors consider silver a reliable hedge against household inflation.
12. Silver vs. Milk (per gallon)
Milk ~ $4.25/gallon
-
1 oz of silver = 15 gallons of milk
Dairy prices represent another key inflation metric for households, yet silver has surpassed these increases by a wide margin. The fact that one ounce buys 15 gallons of milk shows silver’s strong relative performance against consumer staples. This underscores its reliability during inflationary cycles.
13. Silver vs. U.S. Postage Stamps
U.S. First-Class stamp ~ $0.78
-
1 oz of silver = 82 stamps
Stamps are a standardized national pricing benchmark, making them an excellent inflation comparison tool. Silver buying more than eighty stamps shows just how far its purchasing power has grown. As postal rates rise, this ratio provides meaningful context for silver’s long-term strength.
14. Silver vs. Gold (gold price ~$4,285/oz)
1 oz gold = 31.1035 grams
-
1 oz silver ÷ gold price = 0.01494 oz gold = 0.466 grams
This ratio highlights how undervalued silver remains compared to gold, even after its surge above $63. The gold-to-silver ratio remains above 65:1 — still significantly higher than historical norms. This suggests silver may have far more room to appreciate relative to gold, especially during bull market compression cycles.
Why These Comparisons Matter for Investors
These real-world ratios reveal a broader story: silver has dramatically increased in purchasing power, not just in dollar terms but relative to essential goods, energy, and other commodities. This trend aligns with several long-term forces reshaping the market:
-
Electrification is accelerating silver demand faster than supply can respond.
-
Silver’s dual role as a precious and industrial metal creates multi-sector dependence.
-
Supply deficits are widening while industrial usage hits record highs.
-
Inflation continues to erode fiat currency purchasing power, but not silver’s.
Taken together, these comparisons suggest that the current price of silver may not reflect the full extent of future demand.
Silver’s Purchasing Power Signals a New Market Reality
Silver exceeding $63 per ounce is more than a price milestone — it is evidence of a deeper structural shift in global economics. When one ounce of silver can buy a barrel of oil, nearly 400 kWh of electricity, or close to half a gram of gold, it becomes clear that the metal’s role in energy transition and technology has elevated its market significance.
For investors seeking value, diversification, or inflation protection, these comparisons highlight why silver remains one of the most compelling assets of the decade. And with Bullion Exchanges offering competitive pricing and an extensive selection of silver bullion, there has never been a clearer time to evaluate silver’s growing strength in both the marketplace and your portfolio.
Disclaimer: All prices and calculations in this article reflect general market estimates at the time of publication. Because commodity and consumer prices fluctuate regularly, actual values may vary by time, region, and conditions. These comparisons are intended to illustrate silver’s relative purchasing power, not to represent fixed or guaranteed pricing. Investors should refer to live market data when making financial decisions.