How to Read a Gold Price Chart: Technical Basics
Mastering the Fundamentals: Understanding Gold Price Charts
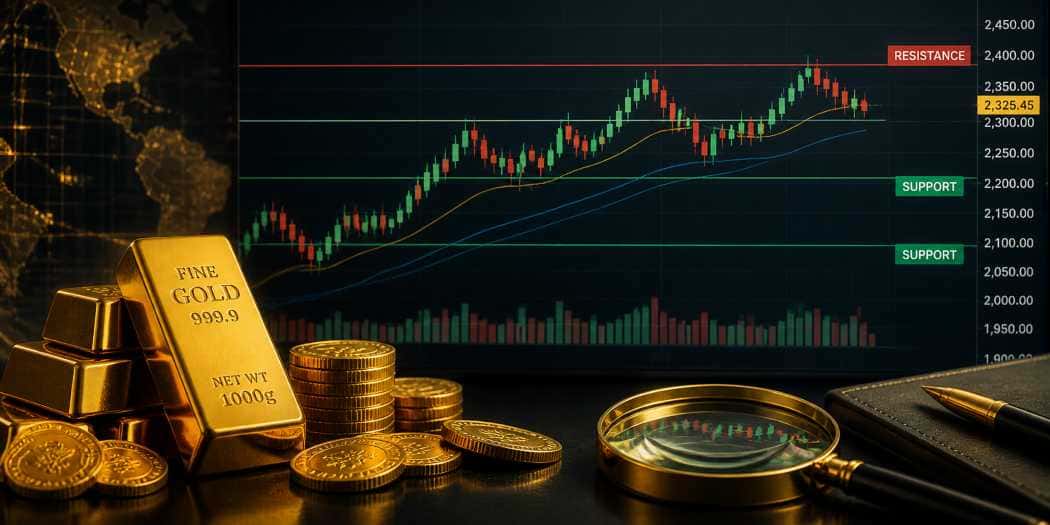
For investors and traders in the precious metals market, reading a gold price chart is essential to understand price trends, make informed decisions, and manage investments effectively. In today’s volatile market, with fluctuating gold spot prices driven by macroeconomic factors, inflation concerns, and geopolitical events, understanding the technical aspects of a gold price chart can significantly impact the outcome of your investment strategies. This article will guide you through key technical indicators, including support, resistance, and moving averages (MA), which are crucial to understanding how gold prices move and what drives them.
Key Components of a Gold Price Chart: Support, Resistance, and Moving Averages
When you look at a gold price chart, the first thing to understand is the concept of support and resistance levels. These technical terms play a critical role in chart analysis, helping investors identify potential price movements and trends. Gold’s price is highly influenced by these levels, as they represent historical price points where gold has either faced difficulty moving above (resistance) or below (support).
-
Support: This is the price level at which gold tends to find buying interest, as it has historically had a tendency to bounce back from this point. Think of it as the “floor” for gold prices.
-
Resistance: Resistance, on the other hand, is the level where prices tend to face selling pressure and struggle to break through. This level can act as a “ceiling” for gold prices.
Moving Averages (MA) are another key element on the chart that traders and investors rely on. These averages smooth out price action and provide a clearer picture of the trend.
Understanding Moving Averages: The Simple and Exponential MAs
Moving averages (MAs) are used to determine the direction of the trend and help traders identify entry or exit points. The two most common types of MAs used in gold price analysis are simple moving averages (SMA) and exponential moving averages (EMA):
-
Simple Moving Average (SMA): This is the most basic form of moving average, calculated by averaging the closing prices over a set number of periods. The 50-day SMA and 200-day SMA are commonly followed by traders to assess the long-term trend of gold prices. When the price is above the SMA, it indicates an uptrend, and when it is below, it signals a downtrend.
-
Exponential Moving Average (EMA): The EMA gives more weight to recent prices, making it more responsive to price changes. The 12-day and 26-day EMAs are often used for short-term trend analysis.
By monitoring these MAs, traders can identify whether the market is trending upward or downward and make better predictions about future price movements.
Interpreting Market Sentiment: Bullish vs. Bearish Signals
In addition to support, resistance, and moving averages, gold price charts often include volume indicators to gauge market sentiment. Volume represents the number of contracts traded or the amount of gold traded during a specific time period. High volume typically suggests that a price move has strong momentum, while low volume indicates weaker momentum. A bullish signal is generated when gold’s price breaks through resistance levels accompanied by high volume, signaling that buyers are in control. Conversely, a bearish signal occurs when gold breaks below a support level on high volume, indicating that sellers are dominating the market.
Macro Events Impacting Gold Prices and Chart Analysis
While technical analysis tools like support, resistance, and moving averages are critical, it’s also important to understand the macroeconomic factors driving the gold market. Global events, including inflation, central bank policies, geopolitical tensions, and interest rates, can cause volatility and break key support or resistance levels. Gold is a safe-haven asset, and in times of global uncertainty—such as economic downturns or geopolitical instability—gold prices tend to rise. Conversely, when the economy is stable, and interest rates are higher, gold often faces pressure as investors flock to higher-yielding assets.
Tracking these fundamental factors alongside technical analysis allows investors to make well-informed decisions about the market.
How to Time Your Purchase Using a Gold Price Chart
One of the most powerful ways to use a gold price chart is to time your purchases. By understanding when gold prices are at support or nearing resistance, you can identify the optimal moments to buy or sell. Watching for bullish crossovers, when the shorter-term moving average crosses above the longer-term moving average, signals that an uptrend may be beginning. Conversely, a bearish crossover, when the short-term moving average crosses below the long-term one, indicates that gold prices could fall.
For the long-term investor, staying aware of gold's market trend and reacting to price breaks or consolidations can enhance returns. If you are buying gold jewelry or gold coins for investment purposes, watching for price dips during market corrections can help you secure better pricing before they rise again.
Projections for the Gold Market in 2026
Looking forward, global uncertainty and inflationary pressures are expected to continue to support gold prices throughout 2026. Central banks are likely to remain in gold-buying mode, maintaining upward pressure on prices. In addition, geopolitical events will keep investors on edge, continuing to create demand for gold as a safe-haven asset. Investors should continue to watch technical indicators and macroeconomic factors, as these will be key to understanding when to act on price movements in the market.
Related reading you may find interesting:
Gold 2008 Crisis Explained: From Selloff to Historic Rally
Understanding Gold Moving Averages: 50-Day and 200-Day Signals Guide