Understanding Gold Moving Averages: 50-Day and 200-Day Signals Guide
Gold Moving Averages: How 50-Day and 200-Day Signals Guide Trends
As gold continues to trade near elevated levels in 2026, technical indicators are playing a larger role in how traders and institutions interpret market direction. Among the most widely followed tools are the 50-day and 200-day moving averages, which help identify trend strength, momentum shifts, and potential reversal points. With macro drivers like interest rate expectations, inflation persistence, and geopolitical tension influencing gold spot price action, understanding how these moving averages interact provides a critical edge for investors navigating today’s gold market.
What Moving Averages Reveal About Gold Price Behavior
Moving averages smooth out price data over a defined period, allowing investors to identify underlying trends rather than short-term volatility.
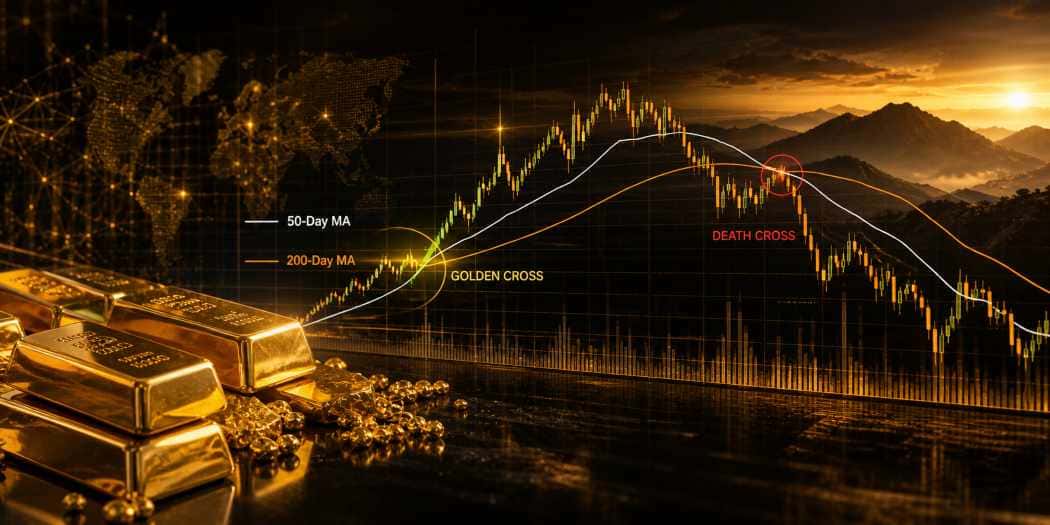
The 50-day moving average (MA) reflects shorter-term momentum, capturing recent price action and shifts in sentiment. The 200-day moving average, by contrast, represents the long-term trend and is widely viewed as a benchmark for overall market direction.
When gold trades above both averages, it signals:
-
Sustained upward momentum
-
Strong investor confidence
-
Supportive macro conditions
When prices fall below these levels, it may indicate:
-
Weakening demand
-
Shifts in interest rate expectations
-
Increased market uncertainty
These indicators are not predictive on their own—but they provide a framework for interpreting broader price movement.
The Golden Cross: A Bullish Trend Confirmation
One of the most important signals in technical analysis is the golden cross.
This occurs when the 50-day moving average rises above the 200-day moving average. In gold markets, this pattern is often interpreted as a confirmation of a long-term bullish trend.
A golden cross suggests:
-
Strengthening upward momentum
-
Increasing institutional participation
-
Alignment between short-term and long-term trends
Historically, golden crosses in gold have coincided with periods of sustained price appreciation, particularly when supported by macro factors such as falling real interest rates or increased central bank demand.
However, timing is critical. The signal often appears after an initial rally has already begun, making it more of a confirmation tool than a leading indicator.
The Death Cross: A Signal of Downward Pressure
The opposite of the golden cross is the death cross, which occurs when the 50-day moving average falls below the 200-day moving average.
This pattern is typically viewed as a bearish signal, indicating:
-
Weakening price momentum
-
Potential trend reversal
-
Increased selling pressure
In gold markets, death crosses often emerge during periods of rising interest rates or a strengthening U.S. dollar—both of which can reduce the appeal of non-yielding assets.
However, like the golden cross, the death cross is not always definitive. In volatile environments, it can produce false signals, particularly if macro conditions shift quickly.
Why Institutions Watch the 200-Day Moving Average
The 200-day moving average holds particular importance for institutional investors.
Many asset managers and trading algorithms use this level as a key threshold for:
-
Risk management
-
Portfolio allocation decisions
-
Trend validation
When gold remains above the 200-day MA, it is generally considered to be in a long-term uptrend. This can attract additional buying from institutional participants, reinforcing price strength.
Conversely, a sustained break below the 200-day MA may trigger:
-
Portfolio rebalancing
-
Increased selling pressure
-
A shift toward defensive positioning
This makes the 200-day average one of the most influential technical levels in the gold market.
Short-Term Signals: The Role of the 50-Day Average
While the 200-day MA defines the broader trend, the 50-day MA provides insight into shorter-term momentum.
Traders often use the 50-day average to:
-
Identify entry and exit points
-
Confirm trend continuation
-
Spot early signs of reversal
In strong bull markets, gold tends to find support near the 50-day MA, using it as a base for further gains. In weaker markets, the 50-day MA can act as resistance, limiting upward movement.
This dynamic makes the 50-day average particularly useful for tactical positioning within a larger trend.
Moving Averages vs Macro Drivers: Which Matters More?
While moving averages provide valuable signals, they must be interpreted alongside macroeconomic factors.
Gold prices are heavily influenced by:
-
Interest rate expectations
-
Inflation trends
-
Currency movements
-
Geopolitical developments
In 2026, for example, shifting expectations around Federal Reserve policy and global energy markets have driven significant price movement. These macro forces can override technical signals, especially in the short term.
The most effective approach is to use moving averages as a confirmation tool, rather than relying on them in isolation.
False Signals and Market Noise
One of the challenges of using moving averages is the potential for false signals.
In volatile markets, gold prices can:
-
Briefly cross above or below key averages
-
Reverse direction quickly
-
Trigger misleading technical patterns
This is particularly common during periods of:
-
Rapid interest rate changes
-
Sudden geopolitical developments
-
Short-term liquidity events
To reduce the risk of false signals, investors often look for:
-
Sustained movement above or below averages
-
Confirmation from volume or other indicators
-
Alignment with macro trends
Combining Moving Averages With Other Indicators
Many investors enhance moving average analysis by combining it with other tools.
Common complementary indicators include:
-
Relative Strength Index (RSI) for momentum
-
Volume analysis for confirmation
-
Support and resistance levels
By integrating multiple signals, investors can gain a more comprehensive view of market conditions.
For example, a golden cross accompanied by strong volume and supportive macro data may provide a higher-confidence signal than the crossover alone.
Gold Moving Averages in the 2026 Market Context
In the current environment, moving averages are reflecting a market shaped by competing forces.
Gold has been supported by:
-
Central bank accumulation
-
Persistent inflation concerns
-
Geopolitical uncertainty
At the same time, higher interest rates and a strong dollar have introduced periods of downward pressure.
This has created a market where:
-
Moving averages are frequently tested
-
Crossovers occur within broader consolidation patterns
-
Technical signals require careful interpretation
Understanding this context is essential for applying moving average analysis effectively.
How Moving Average Signals Fit Into Investment Strategy
For long-term investors, moving averages can help:
-
Confirm broader market trends
-
Identify periods of strength or weakness
-
Guide allocation decisions
For short-term traders, they provide:
-
Entry and exit signals
-
Momentum indicators
-
Risk management levels
In both cases, the key is to view moving averages as part of a broader analytical framework, rather than a standalone strategy.
Where Gold Trends May Be Headed Next
As markets continue to evolve, moving averages will remain a core tool for interpreting gold price action.
The interaction between the 50-day and 200-day averages will continue to signal shifts in momentum, but the ultimate direction of gold will depend on macroeconomic developments.
In a market shaped by inflation, policy decisions, and global uncertainty, moving averages provide a structured way to interpret price movement—but they are most effective when used in combination with a deeper understanding of the forces driving gold demand.
Related reading you may find interesting:
COMEX Gold Futures: 100 oz Contracts Explained