The Gold-to-Silver Ratio: Is It Time to Diversify?
Understanding One of the Most Powerful Signals in the Precious Metals Market
For centuries, the gold-to-silver ratio has been one of the most closely watched indicators among precious metals investors. As of 2025, this historic gauge — representing how many ounces of silver it takes to buy one ounce of gold — has become more relevant than ever. With shifting interest rates, fluctuating industrial demand, and renewed economic uncertainty, the ratio may be sending investors a clear message: it’s time to reassess diversification strategies between gold and silver.
What the Gold-to-Silver Ratio Means
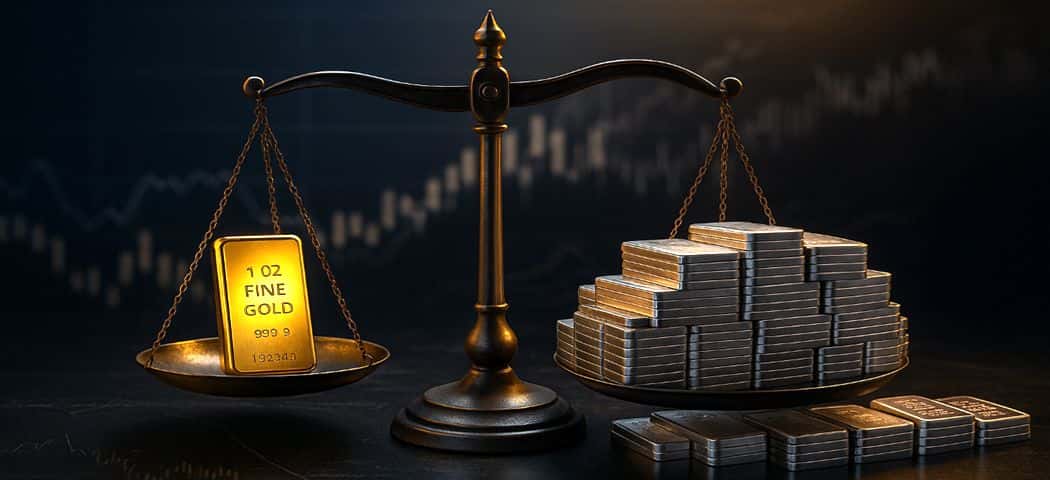
The gold-to-silver ratio measures the relative value between two of the world’s most traded metals. Historically, the ratio averaged around 40:1 to 60:1, meaning that one ounce of gold was typically worth between 40 and 60 ounces of silver.
Today, the ratio frequently moves far beyond that range — reaching above 80:1 in recent trading — suggesting that silver may be undervalued relative to gold.
When the ratio climbs, silver is often considered “cheap” compared to gold; when it falls, gold is viewed as the better value. For investors, these shifts present strategic opportunities to rebalance portfolios, converting between metals to capture potential upside.
Lessons from History: When the Ratio Speaks Loudest
Throughout modern history, the gold-to-silver ratio has acted as a silent barometer for economic sentiment.
-
During the Great Depression, the ratio surged above 100:1, signaling economic distress.
-
In the 1980 silver boom, fueled by industrial demand and speculation, the ratio collapsed below 20:1.
-
In 2020, pandemic uncertainty and unprecedented stimulus drove gold higher, briefly pushing the ratio above 120:1 — a record that preceded a major rebound in silver prices.
Each of these inflection points shared one theme: extremes in the ratio often precede shifts in market direction.
What’s Driving the Ratio in 2025
Several interlocking forces are shaping today’s gold-silver dynamics:
1. Monetary Policy and Interest Rates
As the Federal Reserve signals a potential shift toward another rate cut next month, real yields are easing — typically bullish for both metals. Gold often reacts first as a monetary hedge, while silver tends to lag before catching up with greater volatility.
2. Industrial Demand for Silver
Silver’s dual role as both a precious and industrial metal makes it sensitive to global manufacturing trends. In 2025, demand from electric vehicles (EVs), solar energy, and electronics continues to grow, tightening physical supply chains and strengthening the long-term case for silver accumulation.
3. Investor Psychology and ETF Flows
Gold-backed ETFs have seen steady inflows amid geopolitical uncertainty, while silver funds have started to show renewed strength after months of outflows. This suggests a growing investor shift toward undervalued metals.
The result? Gold remains the stable anchor — but silver’s recovery potential appears increasingly compelling.
Interpreting Today’s Ratio: Opportunity or Warning?
With the gold-to-silver ratio hovering around multi-year highs, history suggests that silver may have room to outperform.
Astute investors often use the ratio as a tactical signal:
-
When the ratio exceeds 80:1, it may be time to increase silver exposure.
-
When it falls below 50:1, investors often rotate back into gold to lock in gains.
These thresholds are not hard rules but long-observed patterns supported by centuries of market behavior. The ratio reflects not only relative pricing, but the broader balance between monetary confidence and industrial expansion — two forces that often move in opposite directions.
Practical Diversification Strategies
Diversifying between gold and silver doesn’t require major portfolio changes — only smart adjustments aligned with market signals.
For gold-focused investors:
-
Add exposure to silver coins or bars such as American Silver Eagles, Canadian Maple Leafs, or Perth Mint Kangaroos.
-
Consider fractional silver rounds or 10-oz bars to maximize flexibility.
For silver-heavy investors:
-
Gradually accumulate fractional or 1-oz gold coins such as the American Gold Eagle or Gold Buffalo, which offer both liquidity and long-term stability.
Tracking the ratio monthly can help investors time these adjustments to optimize cost basis and hedge volatility.
Beyond the Ratio: Factors That Still Matter
While the gold-to-silver ratio is a powerful analytical tool, it should be viewed alongside other fundamentals — including global mining output, central bank activity, currency strength, and inflation expectations. The ratio offers insight into relative value, but real-world demand, production costs, and policy trends ultimately define long-term price direction. Investors also monitor the price of gold as a key driver of broader market sentiment and a benchmark for evaluating undervalued metals.
Adding smaller allocations of platinum or palladium can also enhance diversification, especially as industrial metals gain renewed attention. Meanwhile, fluctuations in the price of silver continue to reflect shifts in manufacturing demand and investor confidence, influencing short-term adjustments in the ratio itself.
The Ratio as a Window into Market Psychology
The gold-to-silver ratio doesn’t predict the future — it reflects investor emotion, economic pressure, and the ongoing balance between risk and refuge.
As 2025 nears its conclusion, silver’s industrial resurgence and gold’s safe-haven status may cause the ratio to compress — a pattern that historically rewards diversified buyers.
For modern investors, understanding this ratio is more than a trading tactic; it’s a way to see how the entire precious metals market breathes.
Related reading you may find interesting:
Silver’s Historic Breakout: Why Prices Surged Past $55 in 2025
Platinum & Palladium: The Hidden Metals of Opportunity
2 Comments